Using Celebrate Urban Birds (CUB) to Meet Common Core and Next Generation Teaching Standards
Grades:
K-12th
Description:
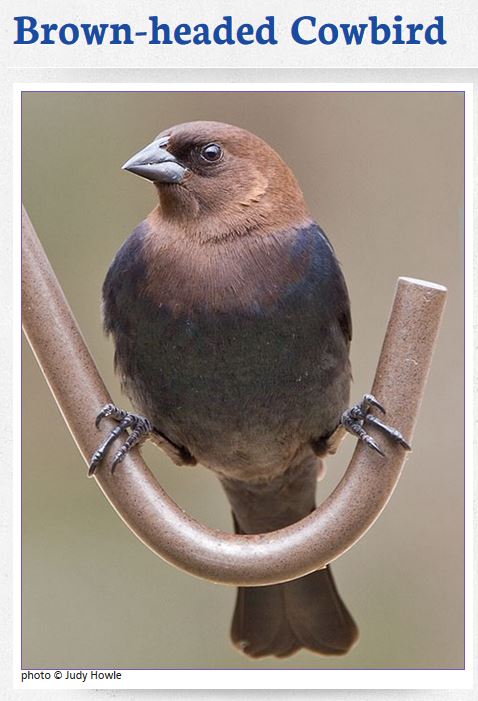
Celebrate Urban Birds (CUB) is a project through the Cornell Lab of Ornithology. It is a year round project specifically designed to engage classrooms with local urban birds and citizen science. Cornell offers a free classroom kit for you and your students when you sign up for the project. They cite that 88% of their partner organizations work with under-served audiences and 75% or more of the participants have little to no experience with birds. The project materials they offer are also bilingual. (Spanish) To participate you need a yard or open area that is about half the size of a basketball court. They are not strict on the size of this area or what is in it as long as you can look out and make observations. CUB focuses on sixteen specific urban birds, with observations lasting 10 minutes each. There is no minimum or maximum participation. These observations are supported with an easy-to-understand data sheet and a bird ID check-sheet with clear images. You can upload your information to the website and the site will show you a bar graph of your sightings. Cornell also offers mini-grants of $100-$750 to support community events and activities around urban birds (from arts and culture to science and nature) and your school.

Materials You’ll Need:
- Computer with internet access and printer.
- The CUB kit is free, but it is not required. You can also download the data sheets and posters without the kit and participate (this may be particularly helpful because the kits can take up to 6 weeks to arrive).
- Data sheet (http://celebrateurbanbirds.org/wp-content/uploads/2012/09/Celebrate-Urban-Birds-Activated-5.pdf)
- Printed list of birds for the study (http://celebrateurbanbirds.org/wp-content/uploads/2012/08/CUBs-Focal-Species-Tally-Sheet-REV.pdf)
- Binoculars (optional)
- Bird field guide (optional)
Why This Citizen Science Project is a Strong Candidate for the Classroom:
- This project can be done in any urban environment.
- The project is free and comes with free classroom materials supplied (including bilingual materials)
- You do not have to be an expert bird watcher to help your students participate in this project.
- Cornell provides training materials for you.
- You can track your data and use it for classroom analysis.
- Cornell strongly supports the “Zero Means a Lot”concept along with the idea that observations with zero birds are still valuable, which is an important lesson for students.
- Students become aware of the wildlife in urban environments and more conscious of the life native to their surroundings.
Teaching Materials:
The CUB website supplies some great background materials such as bird ID information, commonly asked questions, bird id tips, information on attracting birds, and how to create urban green-spaces. Check out their website for a list of suggested books to help with the common core reading requirements. To supplement this project I would also suggest downloading the Cornell University and EE Capacity “Environmental Education in Urban Communities” PDF with 26 lesson plans for urban environments. Which may provide 3 rd through 8th grade lesson support. Some books you may wish to consider for additional support:
- About Birds: A Guide for Children. Cathryn Sill and John Sill. ($4) Ages 3-8
- National Geographic Kid’s Bird Guide of North America: The Best Birding Book for Kids from National Geographic’s HYPERLINK “http://www.amazon.com/National-Geographic-Guide-North-America/dp/1426310943/ref=pd_cp_b_1″Experts.Jonathan Alderfer. ($8) Ages 7-9 [Include urban environments]
- Take a Back Yard Bird Walk (Take a Walk Series). Jane Kirkland. ($2) Ages 9-12
- Bird (DK Eyewitness Books). David Burnie ($6) Ages 8-12
- Fine Feathered Friends: All About Birds (Cat in the Hat’s Learning Library). Tish Rabe ($. 01) Ages 4-8. This series also has lesson plans free online.
- What Makes a Bird a Bird? May Garelick ad Trish Hill. ($2) Ages 5+
- The Young Birder’s guide to Birds of North America (Peterson Feld Guides). Bill Thompson III. ($4) All ages.
Online Safety for Children
This project requires a teacher to sign up for an account either individually or for the entire class. You will need to enter your location so that it can be mapped, but student information is not required.
Common Core and Next Gen. Standards Met:
Kindergarten:
Next. Gen. Science: K-LS1-1 Use observations to describe patterns of what plants and animals need to survive. K-ESS3-1 Use a model to represent the relationship between the needs of different plants and animals and the places they live.
For both of the standards, teachers may use the reading resources suggested in the “Teaching Materials” of this post to help guide a discussion about what birds need to live and survive and the places they live. Students may make a model (or map) of their local ecosystem, labeling the “food, water, and shelter” that the birds might find in their study area.
K-ESS3-3 Communicate solutions that will reduce the impact of humans on the land, water, air and/or other living things in the local environment.
Students should suggest ideas, though drawing or discussion, about the resources that birds need to survive. They may then discuss reducing human impacts on either their particular study nest or nests in general. The support materials provided by CUB for urban greening and creating a “green space” may be used to help construct bird friendly habitat as an activity to go along with the project.
Common Core: Literacy: RI.K.1 With prompting and support, ask and answer questions about key details in a text. W.K.1 Use a combination of drawing, dictating, and writing to compose opinion pieces in which they tell the reader the topic or name of a book they are writing about.
Teachers may use the resources suggested in the “Teaching Materials” section above, and have students read and answer questions about the texts.
W.K.7 Participate in a shared research and writing project.
Teachers may have students write or draw information about their experience and observations while participating in the CUB. Mini-grant opportunities might also provide additional funding for further community based arts and cultural activities.
Math: MP.2 Reason abstractly and quantitatively. MP.4 Model with Mathematics. K.MD.A.2. Directly compare two objects with a measurable attribute in common, to see which object has “more of/less of” the attribute and describe the difference.
By participating in CUB project, students can quantify their observations of the different types of birds they see from month to month. This can go along with data collected about the season, time of year, rainfall, or other meteorological data. The CUB website creates basic bar graphs of the sightings you post, related to the 16 species, which can be used to help students make visual comparisons “more” or “less.”
First Grade:
Next. Gen. Science: 1-LS3-1 Make observations to construct an evidence-based account that young plants and animals are similar to, but not exactly like, their parents.
Teachers may use the resources suggested in the “Teaching Materials” section above to encourage discussion about the life cycle of birds and what young birds look like and how they are different than the parents. In their first year(s) of life many birds retain coloring that makes this look like a female. This coloring protects them from aggression and competition by adult males. Teachers could use this as a discussion point. Teachers may also use the images provided, of the 16 featured species in the CUB project, to conduct a visual comparison of the adult and juvenile plumages.
Common Core: Literacy: Literacy: RI.1.1 Ask and answer key details in a text. RI.1.2 Identify the main topic and re-tell key details of a text. W.1.7 Participate in shared research and writing projects.
Teachers may use the resources suggested in the “Teaching Materials” section above, and have students read and answer questions about the texts. By participating in the CUB project, students may write about their experiences and the results of their data. They may also choose to write about behavioral data relating to what they observed, where the birds were seen, and what the birds were doing.
Math: MP.2 Reason abstractly and quantitatively. MP.5 Use appropriate tools strategically.
After participating in the CUB project, students can quantify their observations, the types of birds seen, bird behavior, and seasonal/meteorological data. This data can be accessed through the CUB website or teachers can provide students with the raw numbers.
Second Grade:
Next. Gen. Science: 2-LS4-1 Make observations of plants and animals to compare the diversity of life in different habitats.
Teachers may have students compare their study site to other areas around the school; and have them catalogue the biotic and abiotic resources for comparison.
K-2-ETS1-2 Develop a simple sketch, drawing, or physical model to illustrate how the shape of an object helps it function as needed to solve a problem.
Teachers may have the students draw the birds they are observing. They may then discuss the birds anatomy and adaptations for flight, finding food, and raising young. A comparison of body and beak shape to food preference may also be helpful. The “Bird Beak Buffet” lesson plan may be useful.
Common Core: Literacy: W.2.6 Recall information from experience or gather information from the provided sources to answer a question. SL.2.5 Create audio recordings of stories or poems; add drawings or other visual displays to stories or recounts of experiences.
Students may recall information from texts (see the “Teaching Materials” section above) or their own experiences with the CUB project to convey information about urban birds, their data, or other findings. If you are focusing on bird beak and body adaptations then the students may create a visual poster or presentation comparing bird food preferences to body or beak shape.
Math: 2.MD.D.10 Draw a picture graph and a bar graph to represent a data set with up to four categories. Solve simple put-together, take-apart, and compare problems using information presented in the bar graph.
Teachers may use the data collected through the CUB project to graph the types of birds that were seen during data collection. You could also try graphing bird behaviors such as feeding/foraging,singing, perching,or other and have students make observations at 2 minute intervals. 
Third Grade:
Next. Gen. Science: 3-LS4-3 Construct an argument with evidence that in a particular habitat some organisms can survive well, some survive less well, and some cannot survive at all.
Teachers may have students compare their CUB project study site to other areas, and have students catalogue the biotic and abiotic resources (also the pervious v. Impervious surfaces) as well as the bird species present. The students may then make a hypothesis about why specific species may or may not be present.
3-LS4-4 Make a claim about the merit of a solution to a problem caused when the environment changes and the types of plants and animals that live there may change.
Students should compare their CUB observations and then discuss why the birds showed up there (or live there) and what would happen to the flora and fauna if the area became more or less developed. They should then offer either a drawn, written, or verbal solution that would mitigate these effects. The entire class should discuss solutions. This standard may also be approached as a “Green School” activity or assessment, of how eco-friendly their school is to birds and wildlife, and then offering possible solutions. The Cornell website has free lessons on “urban gardening for schools,” “providing water for birds,” and “providing nesting materials.”
3.LS1-1 Develop models to describe that organisms have unique and diverse life cycles, but all have in common birth, growth, reproduction, and death.
Teachers may use the reading materials in the “Teaching Resources” section above to help students develop models of the life cycle of birds. This may be compared to the life cycles of other organisms such as mammals, or with creatures that have complete and incomplete metamorphosis such as frogs and dragonflies.
Common Core: Literacy: W.3.9 Recall information from experience or gather information from print and digital sources; take brief notes on sources and sort evidence into provided categories. SL.3.4 Report on a topic or text, tell a story, or recount an experience with appropriate facts and relevant, descriptive details, speaking clearly at an understandable pace.
Teachers may use the resources suggested in the “Teaching Materials” section above, and have students read and answer questions about the texts. By participating in the CUB project, students should be able to recount their experience and write the relevant information about their research project, data, and analysis.
Math: MP.2 Reason abstractly and quantitatively. MP.4 Model with mathematics. MP.5 Use appropriate tools strategically. 3.MD.B.3 Draw a scaled picture graph and a scaled bar graph to represent a data set with several categories.
Using data from the CUB project teachers can have students draw scaled graphs to represent their observations. You could also try graphing bird behaviors such as feeding/foraging, singing, perching, or other behaviors and have students make observations at 2 minute intervals. Alternatively, students could also quantify the study area habitat and measure it. The categories could include pervious surfaces (paved), bushes and shrubs, grass, and “other” possibilities (bird houses, feeders, etc.)
Fourth Grade:
Next. Gen. Science: 4-ESS2-2 Analyze and interpret data from maps to describe patterns of Earth’s features.
You can use the topography and urban geography of your location as a part of the description of where (and why) you find the birds you observe. I would also suggest using Cornell’s website called eBird to upload data and maps to meet this standard. eBird offers data, Google Earth maps, bar charts, and line graphs of data. This data can be sorted by region, season, sightings, species, etc. so you can pull everything you need from for your lesson (this could even be assigned to the students). You may wish to focus on the range maps of three or four of the study species found in the CUB project. Have students study these maps, the birds’ ranges, and the geographic features of their ranges (this can be done by season too). Students may then suggest patterns and reasons for what they observe.
Common Core: Literacy: W.4.8. Recall relevant information from experiences or gather relevant information from print and digital sources; take notes and categorize information, and provide a list of sources. W.4.9 Draw evidence from literary or informational texts to support analysis, reflection, and research.
Teachers may use the resources suggested in the “Teaching Materials” section above, and have students read and answer questions from the texts relating to the specific birds in their CUB project. Students may take notes and list their sources relating to the project. Teachers may also have students research the particular species using eBird (see above) and use data from the website to support their research, or to find out the range of the birds.
Math: MP.4 Model with mathematics.
To meet this standard, I would suggest either modeling the data from your observations, or using Cornell’s eBird site to download more extensive sets of data about the birds. You could assign students a specific bird from the CUB project and have them use the eBird website (or help them). On the website you can download information for your specific state and county about the bird’s frequency, abundance, high count, totals, range, etc. The graphs can be analyzed and use to model population changes.
Fifth Grade:
Next. Gen. Science: 5-LS2-1 Develop a model to describe the movement of matter among plants, animals, decomposers, and the environment.
Teachers may assign students to draw or model the food web from their study site(s). They may then draw the flow of matter and energy from producers to consumers.
Common Core: Literacy: RI.5.1 Quote accurately from a text when differentiating what the text says explicitly and when the student is drawing inferences from the text. RI.5.9 Integrate information from several texts, supporting a point of view with reasons and information. SL.5.5 Include multimedia components and visual displays in presentations when appropriate to enhance the development of the main ideas or themes.
You may wish to assign students to research one of the 16 featured birds from the CUB study. Have them research why these particular birds are adapted to urban environments compared to other species of birds. Students may use eBird data or maps to supplement their multimedia report. They may also wish to use Google Scholar or internet search engines to research papers about birds in urban environments. One special example is “Pale Male” the red-tailed hawk that lives in New York city.
Math: MP.2 Reason abstractly and quantitatively. MP.4 Model with mathematics. MP.5 Use appropriate tools strategically.
To meet this standard I would suggest either modeling the data from your observations, or using Cornell’s eBird site to download more extensive sets of data about the birds. You could assign students a specific bird from the CUB project and have them use the eBird website (or help them). On the website you can download information for your specific state and county about the bird’s frequency, abundance, high count, totals, range, etc. The graphs can be analyzed and use to model population changes.

Middle School:
Next. Gen. Science: MS-LS2-4 Construct an argument supported by empirical evidence that changes to physical or biological components of an ecosystem affect populations.
Teachers may have students conduct an ecological survey of biotic and abiotic elements in their local CUB project study plot, along with a less urbanized study plot. This can go along with their CUB project data. Students should inventory all the living organisms in the ecosystems. They may then construct an argument, based on their observations, that physical changes to an ecosystem affect populations. This may also be conducted by having students analyze the flow of energy through the ecosystem by having students classify producers, primary, secondary, and tertiary consumers in the ecosystems and relating these to the species of bird studied and its places in this “food-web”.
MS-LS2-2 Construct an explanation that predicts patterns of interactions among organisms across multiple ecosystems.
Teachers may assign students to analyze data their CUB project, relating to a specific species of bird. Students may hypothesize about what makes their urban environment a good place to live. This may include temperature, geographic region, topography or other factors. Data from eBird should be used. Download regional data so that students can compare their sightings to state and national trends.
Common Core: Literacy: WHST.6-8.2 Write arguments to support claims with clear reasons and relevant evidence.
Teachers may have students research one of the 16 species featured in the CUB project and then related the abundance of that species to its food preference or adaptations. Students may also conduct research comparing urban bird populations to other bird populations. Data from eBird may be used. Download regional data so that students can compare their sightings to state and national trends.
Math: MP.4 Model with mathematics. 6SP.B.5 Summarize numerical data sets in relation to their context.
To meet this standard I would suggest either modeling the data from your observations, and/or using Cornell’s eBird site to download more extensive sets of data about the birds. You could assign students a specific bird from the CUB project and have them use the eBird website (or help them). On the website you can download information for your specific state and county about the bird’s frequency, abundance, high count, totals, range, etc. The graphs can be analyzed and use to model population changes.
High School:
Next. Gen. Science: HS-LS2-2 Use mathematical representations to support and revise explanations based on evidence about factors affecting biodiversity and populations in ecosystems of different scales.
To meet this standard I would suggest having students create a hypothesis about birds and urbanization, perhaps focusing on one or more of the species from the CUB project. They may then conduct research by modeling the data from their observations, and using Cornell’s eBird site to download more extensive sets of data about the birds. On the website you can download information for your specific state and county about the bird’s frequency, abundance, high count, totals, range, etc. The graphs can be analyzed and used to model population changes. Alternatively, students could compare native birds versus non-native birds and compare and contrast sightings and observations.
HS-LS2-7 Design, evaluate, and refine a solution for reducing the impact of human activities on the environment and biodiversity.
In tandem with the requirement mentioned above (HS-LS2-2) students may offer solutions for bio-remediation of their specific urban ecosystem for native bird species. They may wish to use some of the resources provided by Cornell regarding urban greening and gardening for birds.