Editor’s Note: This is a two-part post, a version of which first appeared on the author’s blog.
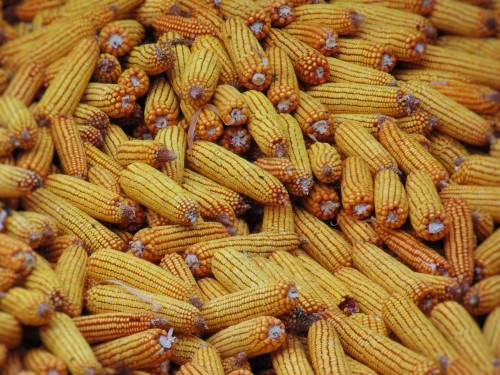
Drive through the United States, and one thing you will notice is a high degree of repetition in the scenery. Highways cross through large fields of near-identical corn and soy crops, punctuated by towns containing a similarly small set of franchises. This is not an easy knock on the cultural blandness of contented societies but rather, I suspect, two factors deeply connected with our path to near-limitless calories.
For the first time in history our species has achieved the feat of having more overweight people than those who go hungry. How we got here is an interesting story combining the rise of the technology needed to run large-scale farms with agricultural policies geared towards the production of cheap staple crops (For a good introduction to the topic my favorite is the documentary King Corn.). What sounds strange, at least at first, is that the issue of malnourishment has not declined in a similar fashion. This is an immediate result of improvements made in the availability of cheap, though not necessarily nutritious, calories.
The areas where this discrepancy lives has a name: food deserts.The US Department of Agriculture (USDA) defines food deserts as
Urban neighborhoods and rural towns without ready access to fresh, healthy, and affordable food. Instead of supermarkets and grocery stores, these communities may have no food access or are served only by fast food restaurants and convenience stores that offer few healthy, affordable food options. The lack of access contributes to a poor diet and can lead to higher levels of obesity and other diet-related diseases, such as diabetes and heart disease.
An area qualifies as a food desert, according to the USDA if it meets the following two criteria:
- They qualify as “low-income communities”, based on having: a) a poverty rate of 20 percent or greater, OR b) a median family income at or below 80 percent of the area median family income; AND
- They qualify as “low-access communities”, based on the determination that at least 500 persons and/or at least 33% of the census tract’s population live more than one mile from a supermarket or large grocery store (10 miles, in the case of non-metropolitan census tracts).
If you’re interested in seeing if you live in a food desert check the USDA’s map here.
Think of the word ‘desert’. In a standard ecological sense it is a place which lacks access to significant water. With food deserts the name is somewhat of a misnomer as there is still plenty of food available from fast food restaurants and convenience stores. It would however be more appropriate to describe them as ‘nutrient deserts’.
This brings up a couple of interesting questions.
With a lack of nutrients is there a corresponding lack of choice? Do the same monocultures (corn and soy) which show up in our production of cheap food also show up in the venues available for its consumption?
Why are these questions important?
Data about nutrient availability and food choices, especially when mapped, would be of great use for both public policy and commercial applications as well as pure research. For example, anyone planning to move could compare prospective homes based on the nutritional profile of the neighborhood in much the same way people currently use WalkScore for transport accessibility and Zillow for property value trends. For both urban planners and researchers it could be helpful to visualize the food infrastructure of cities as ecosystems so as to better spot the factors related to the appearance and persistence of food deserts.
This could lead to whole new set of questions. For example, do places with low level of food venue diversity, those dominated by a few franchises, tend to have populations with less access to nutritious food and more vulnerable to external supply shocks? One would then expect to see a low level of food distribution diversity, but would this then be tied to its quality and availability? Would this diversity in turn have anything to do with the income of the area? It could be reasonably argued that diverse ecosystems are more resilient to external shocks as niches vacated by one extinction could be filed by similar species.
These challenges are part of the nascent field of urban ecology. But how do go about collecting the data required to tackle them?
A framework for evaluating the food distribution ecosystem
To answer the question about nutrient deserts, we will need to choose the appropriate framework to collect data. Below I propose one such method.
First, we define a metric which could quantify the diversity of food sources in a community. Second, we compare this diversity metric to the median income of the community and to its access nutritious food. Without positing any cause and effect at this point it would be possible to test if communities which could be called food (nutrient) deserts would also tend to have a low diversity in the sources for nutritious food.
The second metric can be taken from already existing data sets, such as those generated by the USDA. For the first metric we have a concept which we can borrow from ecology: the Shannon index. Let’s take a small detour to discuss this important concept before turning our focus back to food deserts.

Unpacking this equation the variables are as follows:
- H is the Shannon index, also known as the Claude-Shannon entropy of a system. Entropy, in general, is a measure of how much information it takes to describe a system. It is also a good way to describe the complexity (entropy) of a system. For example, if one has an image file which is 480 pixels on a side and completely filled with the same shade of red it would be easy to describe the file with a brief description of the image dimensions and the fill color, thus giving the image a low measure of entropy. A similarly sized section of the Mona Lisa has a far higher measure of entropy as it would take far more information to describe the image in sufficient detail. Thus, the more complex a system, the larger the Shannon index. In applying this formula to describing the diversity of ecosystems one will find that diverse ecosystems, such as coral reefs, will tend to have high entropies and that ecosystems dominated by large numbers of a few species, such as polar oceans, tend to have low entropies.
- i is an index running from 1 to R. In an ecosystem the number R describes how many species there are.
- pi is the population of species i. This is determined by counting, or more often estimating, the population of the species in an ecosystem.
To give a few examples of how to use this formula consider a simple ecosystem with 100 brine shrimp, 900 bacteria, and 9,000 pieces of algae. The total number of organisms is 100+900+9,000 = 10,000. The fraction of the overall population covered by brine shrimp is therefore 100/10,000=0.01, the bacteria cover a fraction of 900/10,000=0.09, and the algae cover the remaining 0.90. Calculating the Shannon index for this ecosystem based on the formula above,
H = -0.01*ln(0.01) + -0.09*ln(0.09) + -0.90*ln(0.90) = 0.358
How would this then compare to a hypothetical ecosystem where we had 100 species, each of which took up an equal share (0.01) of the population? In that case our entropy for the ecosystem would be:
H = -0.01*ln(0.01) + -0.01*ln(0.01) + …. + -0.01*ln(0.01) = 4.61
As you can see, the second system is far more complex than the first one. These examples are far simpler cases than would typically be encountered in nature, but they demonstrate how we can succinctly differentiate diverse and homogenous ecosystems using the Shannon index.
But how does this relate to the food distribution ecosystem and what does all this have to do with citizen science? In the next post, I will discuss just that.